Disclosure: This site is reader supported and purchases made through the links may generate a commision. Thanks for help supporting the site. Information only – not to be considered financial advice.
You might be surprised to learn that one precious metal has surged 47% in value this year – outperforming its more famous counterpart by a wide margin. This rally marks its strongest showing in over a decade, with prices hitting levels not seen since 2010. What does this mean for your investment strategy?
Market experts like Nate Miller from Amplify ETFs point to a critical metric sitting at 85 – far above its historical average. This divergence suggests potential opportunities for those paying attention to shifting patterns in wealth preservation assets. With inflation concerns and currency fluctuations reshaping portfolios, understanding these dynamics becomes essential.
Economic forces are creating a perfect storm for metals investors. Sticky price pressures, combined with renewed interest in tangible assets, have pushed demand to new heights. While both metals play vital roles, one appears positioned for stronger growth based on industrial applications and supply constraints.
Key Takeaways
- One metal’s 2024 performance outpaces its counterpart by 6%
- Current metrics sit 30% above historical averages
- Industrial demand and limited supply boost upside potential
- Inflation concerns drive safe-haven asset interest
- Strategic analysis required for optimal portfolio allocation
Navigating this landscape requires smart tools. Discover tailored solutions for your metals strategy with the Gold IRA Match App – explore options at GoldIRAMatchApp.com.
Find the Best Precious Metals Company to Fit your Needs
It’s all on the PreciousMetalsCentral.com list of the Best for 2026!
Understanding the Gold-Silver Ratio
Imagine tracking a financial metric that’s guided traders since ancient civilizations. The gold-silver ratio does exactly that – acting like a financial compass for comparing two metals’ values. Let’s break down why this number matters and how it shapes investment decisions today.
What’s Behind the Numbers?
Calculating this ratio is straightforward: divide the price of one ounce of gold by silver’s price. Right now, it takes about 85 ounces of silver to match one ounce of gold’s value. This figure sits well above the long-term average of 65:1, hinting at interesting market dynamics.
Historical patterns reveal wild swings. For example:
- Roman Empire: 12:1 standard
- 1792 U.S. Coinage Act: 15:1 fixed rate
- Modern crises: Spikes above 100:1
Why Context Matters
Governments once set fixed ratios, but today’s markets dance to different tunes. Industrial needs, mining outputs, and economic policies now drive fluctuations. Check out how key eras compare:
| Time Period | Average Ratio | Key Influence |
|---|---|---|
| Ancient Egypt | 2:1 – 4:1 | Cultural value |
| 19th Century | 15:1 – 16:1 | Bimetallic standards |
| Post-1971 | 40:1 – 100:1 | Fiat currency shifts |
This ratio isn’t just math – it’s a story of supply chains, investor psychology, and global economics. While the calculation stays simple, interpreting its signals requires understanding these layered factors.
Current Market Signals Impacting Precious Metals
The financial climate is heating up with pressures that favor tangible assets. Three powerful forces – persistent inflation, currency fluctuations, and geopolitical risks – are rewriting the rules for wealth preservation. Savvy investors are watching these signals closely to navigate today’s unpredictable markets.

Inflation, Dollar Weakness, and Safe-Haven Demand
Stubborn price increases continue to outpace central bank targets, eroding purchasing power faster than expected. This environment makes hard assets particularly attractive. When the dollar loses strength, as it has recently, metals often gain appeal as alternative stores of value.
Safe-haven interest has doubled since 2022 according to market data. Political uncertainty and questions about monetary policy independence add fuel to this trend. Investors increasingly view physical assets as insurance against systemic financial risks.
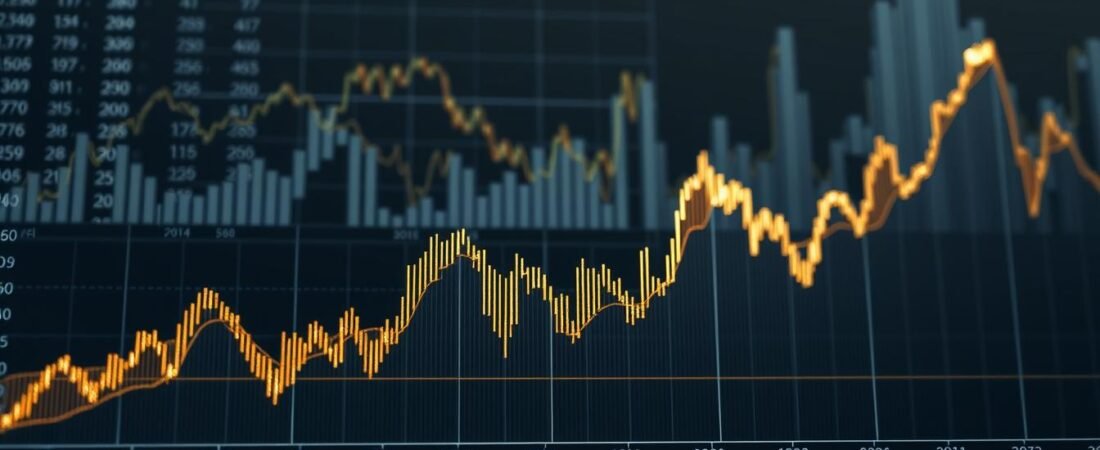
Recent Record Highs and Market Dynamics
Monday’s trading session saw historic moves. One ounce reached $42.96 – levels last observed during the 2011 debt ceiling crisis. Another metal simultaneously hit $2,725, demonstrating broad-based momentum.
These breakthroughs reflect more than temporary speculation. Mining production constraints and industrial applications create structural support for prices. Unlike past rallies, current trends show sustained institutional participation through ETFs and futures markets.
Market analysts note: “We’re witnessing a fundamental repricing of risk assets versus tangible stores of value.” This shift suggests lasting changes in how portfolios get constructed during periods of economic uncertainty.
silver gold ratio undervalued: Significance for Investors
What if your portfolio’s next big opportunity hides in plain sight? Market patterns reveal compelling advantages when traditional metrics diverge from historical norms. The current environment presents a rare alignment of industrial demand and monetary uncertainty that smart asset allocators can’t ignore.
Identifying Undervalued Opportunities
Historical comparisons show metal prices often revert to long-term averages. Right now, one asset trades at levels suggesting 40% upside potential compared to its counterpart. Consider these indicators:
- Mining ETFs outperforming tech stocks YTD
- Industrial consumption growing 8% annually
- Central banks diversifying reserves beyond traditional assets
Investor Strategies in a Shifting Market
Rebalancing your holdings could unlock hidden value. Focus on assets with dual-purpose applications – those serving both financial security and technological innovation. “Diversification into undervalued sectors provides ballast during market storms,” notes Nick Cawley of Solomon Global.
Three tactical approaches merit consideration:
- Allocate to mining companies with proven reserves
- Use dollar-cost averaging during price dips
- Monitor manufacturing trends influencing material demand
Platforms like the Gold IRA Match App simplify position adjustments while maintaining tax advantages. Remember – market extremes often create the most lucrative entry points for patient investors.
Industrial Demand, Supply Constraints, and Economic Factors
Your smartphone and solar panels share an unexpected connection – both rely heavily on a single conductive metal. This dual role creates unique market forces that shape investment opportunities.
Tech-Driven Consumption Patterns
Modern manufacturing devours over 50% of annual production for essential components. Solar energy systems now use 15% of global output – enough to power 40 million homes yearly. Medical devices and 5G infrastructure further tighten availability.
Unlike purely financial assets, this metal’s value gets boosted by real-world innovation. Every electric vehicle contains 25% more conductive material than gas-powered cars. Renewable energy targets could triple industrial needs by 2035.
Production Challenges and Market Effects
Mining outputs haven’t kept pace with consumption growth. Top producers struggle with:
- Ore quality dropping 28% since 2010
- Permitting delays averaging 15 years for new sites
- Recycling rates below 20% for tech waste
| Factor | Industrial Demand | Monetary Demand |
|---|---|---|
| Growth Driver | Technology adoption | Inflation hedging |
| Price Sensitivity | Long-term contracts | Daily market swings |
| Supply Response | 5-7 year lag | Immediate ETF flows |
These dynamics create what analysts call “the squeeze play” – rising needs meet stubborn production limits. Your portfolio allocation should reflect this structural imbalance favoring tangible assets with real-world utility.
Utilizing the Gold IRA Match App for Your Investment Needs
Navigating precious metals investments just got simpler with tools designed for modern investors. The Gold IRA Match App acts like a personal concierge, cutting through market noise to connect you with trusted partners. Let’s explore how this solution streamlines your wealth protection strategy.
Key Features and Benefits of the App
This platform transforms complex research into actionable insights. Three standout features help you make confident choices:
- Side-by-side comparisons of storage fees and buyback policies
- Verified customer reviews highlighting service quality
- Custom filters for IRA options and physical asset storage
One user noted: “I found a company with 24/7 account access in under 10 minutes – something that took weeks manually.” The app’s algorithm updates daily, ensuring you see current data on over 50 providers.
How to Find the Best Gold Company for Your Portfolio
Your ideal partner depends on three key factors:
- Investment timeline (short-term trades vs. retirement planning)
- Preferred asset mix (coins, bars, or IRA-approved products)
- Risk tolerance and storage security needs
The app’s matching quiz analyzes these elements against vetted companies. You’ll receive tailored recommendations showing how each option aligns with your goals. This approach saves hours while reducing exposure to unreliable dealers.
Ready to upgrade your strategy? Discover partners specializing in your unique needs at GoldIRAMatchApp.com – your gateway to smarter precious metals decisions.
Historical Context and Modern Trends in Precious Metals
History often holds clues to tomorrow’s market moves. By studying past patterns, you can spot opportunities hidden in today’s price charts. Let’s explore how economic shocks and technological advances reshape wealth preservation strategies over decades.

Past Performance and Ratio Shifts Over Time
Major events consistently create price imbalances. During World War II, governments printed money aggressively. Investors rushed to one metal for safety while industrial demand for another collapsed temporarily.
Look at these pivotal moments:
| Time Period | Key Event | Market Impact |
|---|---|---|
| 1800s | Industrial Revolution | Factory demand tripled industrial use |
| 1940s | Global Conflict | Currency instability boosted safe-haven flows |
| 2020 | Pandemic Shutdowns | Ratio hit 100:1 before 100% rally |
Notice a pattern? Extreme ratios often correct sharply. One metal surged 100% in four months after March 2020’s peak. Recovery phases tend to favor assets with industrial applications.
Modern Economic Events and Their Impact
Today’s markets face unique pressures. Central bank policies now compete with green energy needs. Renewable tech consumes 15% of annual production for one metal – a demand stream that didn’t exist 50 years ago.
Recent years show three critical shifts:
- Monetary easing programs lifting both metals
- Tech innovation creating permanent demand bases
- Supply chain delays extending price support
“The rules have changed,” says commodities analyst Tara Chen. “Investors must weigh inflation hedges against material needs for solar panels and EVs.” Your strategy should balance historical wisdom with emerging realities.
Conclusion
Market shifts often whisper opportunities before they become obvious trends. With the current metric at 85 ounces of silver per gold ounce, historical patterns suggest potential rebalancing ahead. This moment invites careful analysis of how industrial demand and monetary needs might reshape valuations.
Industrial needs now consume over half of annual silver production, while mining outputs struggle to keep pace. At the same time, economic uncertainties keep gold’s appeal strong as a stabilizer. These forces create a rare scenario where both metals could play complementary roles in diversified portfolios.
Your strategy should weigh tangible applications against financial safeguards. Tools like the Gold IRA Match App simplify comparing storage options and pricing trends. Whether adjusting allocations or entering the market, informed decisions beat reactive moves every time.
The next move could define your portfolio’s resilience in uncertain times. Explore how shifting ounces between assets might unlock hidden value while protecting against volatility. Smart positioning today often becomes tomorrow’s advantage.