Disclosure: This site is reader supported and purchases made through the links may generate a commision. Thanks for help supporting the site. Information only – not to be considered financial advice.
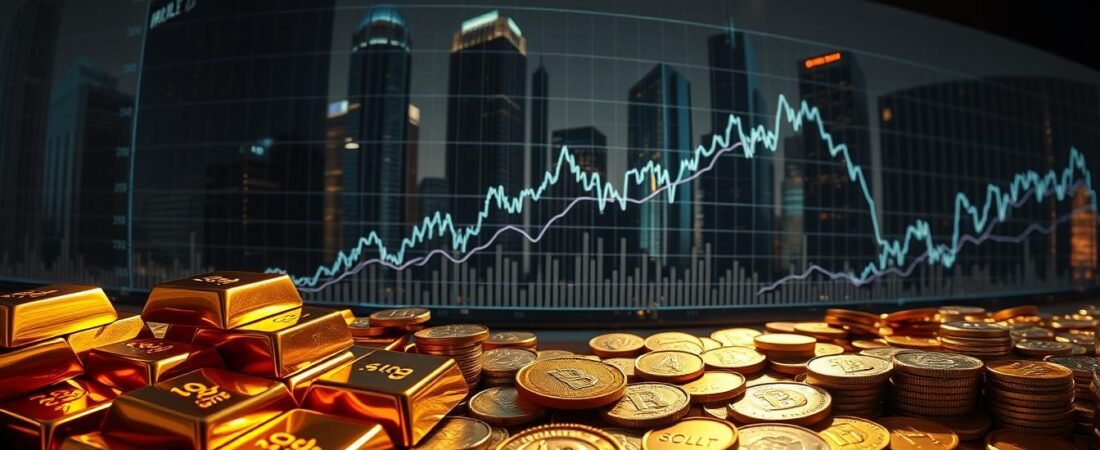
Gold stunned financial experts by hitting $3,500 per ounce in April 2025 – a 30% leap since January. This surge isn’t isolated. Platinum jumped nearly 50% in six months, while silver and palladium both cleared 20% gains. J.P. Morgan analysts predict even bigger moves ahead, forecasting prices could touch $4,000 by mid-2026.
What’s driving this historic rally? Central banks bought over 900 tonnes of bullion last year alone. Global uncertainty pushes institutions and individuals toward time-tested stores of value. Unlike volatile tech stocks or cryptocurrencies, these assets offer stability when markets wobble.
Diversification strategies now prioritize tangible resources. The S&P GSCI Commodity Index shows metals outperforming energy and agriculture sectors by wide margins. Financial advisors increasingly recommend allocating 5-15% of portfolios to this category for balance.
New tools simplify entry into this space. The Gold IRA Match App helps investors find trusted partners for retirement accounts holding physical assets. As inflation concerns linger, such options grow more appealing.
Key Takeaways
- Gold prices reached record highs in 2025, with experts predicting continued growth
- Platinum outperformed other commodities with 50% gains in six months
- Central bank purchases exceed 900 tonnes annually, boosting market demand
- Commodity indexes show metals leading other sectors in returns
- Specialized tools help streamline portfolio diversification strategies
Introduction: The Evolving Landscape of Precious Metals in 2025
Global markets are experiencing a seismic shift in value preservation strategies. Escalating Middle East conflicts and record-breaking bullion purchases by institutions have reshaped the financial playbook. This transformation reveals new opportunities for those seeking stability in turbulent times.
What’s Driving the Trend?
Three forces dominate the current rally. First, persistent inflation erodes confidence in paper currencies. Second, central banks now hold 22% more gold than five years ago. Third, nations like China and India actively reduce dollar reserves, opting for tangible alternatives.
Monetary policies amplify these effects. Aggressive rate hikes create currency volatility, while supply chain bottlenecks limit metal production. The result? A perfect storm boosting long-term asset appeal.
Global Economic Factors at Play
Governments worldwide injected $12 trillion into economies since 2022. This fiscal expansion fuels price pressures while weakening traditional investments. Commodity indexes tell the story:
| Factor | Impact on Metals | 2025 Projection |
|---|---|---|
| De-dollarization | +18% demand growth | Accelerating |
| Manufacturing delays | Platinum shortage | 6-8 month backlog |
| Central bank purchases | 900+ tonnes/year | Record highs |
These conditions make portfolio diversification essential. Physical assets now serve as both shields against uncertainty and growth engines during market rebounds.
Market Trends and Price Movements of Key Metals
Financial markets witnessed historic price rallies across precious metals during the first half of 2025. This surge created fresh opportunities for investors seeking portfolio balance through tangible assets. Let’s examine what’s driving these remarkable gains.
Gold’s Unprecedented Rally
Gold smashed records in April 2025, reaching $3,500/oz. Trade policy shifts and monetary uncertainty fueled this climb. Analysts project prices could average $3,675/oz by year-end, with $4,000 targets for 2026.
Platinum and Silver Outperform
Platinum’s 49.8% surge shocked markets, jumping from $900 to $1,360 since January. Supply shortages in South African mines and green tech demand explain this breakout. Silver followed closely with 25% gains, hitting $37 – its highest since 2011.
| Metal | 2025 Gain | Key Driver |
|---|---|---|
| Gold | 30% | Monetary policy shifts |
| Platinum | 49.8% | Green hydrogen demand |
| Silver | 25% | Solar panel expansion |
| Palladium | 21% | Supply chain issues |
These movements reflect deeper market changes. Renewable energy projects now consume 18% of annual silver production. Palladium’s resilience shows how supply factors can override weak auto sector demand.
As the S&P GSCI Index confirms, metals consistently outperform other commodities. This trend offers savvy investors multiple entry points across different market segments.
why invest in precious metals 2025
Record-breaking ETF inflows reveal a seismic shift in wealth preservation strategies. Physically backed gold funds attracted $38 billion in H1 2025 – the strongest start since 2020’s pandemic surge. North American buyers accounted for 55% of this total, signaling robust confidence among experienced market participants.
These assets deliver three core advantages traditional options lack. First, they act as inflation-resistant anchors during currency fluctuations. Second, industrial applications in solar tech and medical devices create dual demand streams. Third, central banks continue absorbing 710 tonnes quarterly, stabilizing price floors.
| Region | ETF Inflows (2025) | Primary Metal Focus |
|---|---|---|
| North America | $21B | Gold (78%) |
| Europe | $9.4B | Platinum/Silver |
| Asia-Pacific | $7.6B | Gold/Palladium |
Modern tools simplify entry into this evolving market. The Gold IRA Match App helps match your goals with IRS-approved custodians in minutes. As renewable energy projects consume 18% of annual silver production, these resources become essential for capitalizing on industrial demand.
Balancing your holdings with tangible assets provides geographic diversification and political neutrality. Unlike digital securities, physical metal ownership offers protection against cyber risks and institutional defaults. This strategic layer strengthens portfolios against 21st-century financial challenges.
The Role of Gold as a Safe-Haven and Diversification Asset
Investors seeking stability in turbulent markets often turn to time-tested solutions. When currencies fluctuate and stocks swing, one ancient asset continues shining through economic storms.

Historical Data and Long-Term Returns
Gold delivered 9.2% average annual returns since 2000, outpacing bonds during recessions. Over the last 25 years, it preserved wealth better than 78% of S&P 500 stocks during market crashes. This track record explains why institutions maintain 5-15% allocations in balanced portfolios.
| Asset Class | Liquidity Score | 10-Year Return | Crisis Performance |
|---|---|---|---|
| Gold | 98/100 | +189% | +42% (2020-2025) |
| Real Estate | 65/100 | +112% | -18% |
| Tech Stocks | 89/100 | +240% | -34% |
Comparing Gold to Alternative Investments
Unlike property requiring maintenance or stocks tied to company performance, physical gold needs no upkeep. It trades 24/7 globally, converting to cash faster than most assets during emergencies. While equities may offer higher gains in bull markets, they crumble when geopolitics heat up.
Consider this: A 10% gold allocation reduced portfolio volatility by 23% since 2010. Its negative correlation with stocks acts like financial shock absorbers. When the dollar weakens, gold often strengthens – balancing your exposure naturally.
Navigating Volatility and Managing Investment Risks
Recent policy shifts have reshaped commodity markets, creating both challenges and opportunities. Strategic positioning helps turn turbulence into advantage, especially when geopolitical decisions send shockwaves through global exchanges.
Impact of Trade Policies and Tariffs
President Trump’s 50% tariff on imported copper pushed U.S. futures to record highs this spring. These measures create price gaps between domestic and international markets – arbitrage opportunities now exceed 12% for savvy traders. A proposed 25% tariff on Japanese imports could further disrupt supply chains, particularly in aerospace manufacturing.
Three key effects emerge from trade interventions:
- Increased production costs for manufacturers using imported materials
- Higher profit margins for domestic mining operations
- Shifted demand toward tariff-exempt commodities
Strategies to Mitigate Market Uncertainty
Diversification remains your strongest defense. Consider these approaches:
- Allocate across multiple metals to balance industrial and safe-haven exposure
- Use options contracts to hedge against sudden price drops
- Monitor the S&P GSCI Index for sector-wide trends
Maintaining liquidity lets you capitalize on sudden dips. The copper tariff situation shows how quickly markets react – having cash reserves positions you to act when others panic.
Remember: Volatility isn’t your enemy. It’s a tool for those prepared with clear entry/exit plans and risk thresholds. Stay informed about central bank moves and tariff updates – these often signal coming price swings.
Innovations in Investment Platforms and Trading Tools
Digital transformation reshapes how you interact with tangible assets. Modern solutions now blend physical security with digital convenience, creating seamless entry points for diverse portfolios.

Emerging Technologies Reshape Access
Global ETF inflows hit 310 tonnes this year – 10% of total holdings. U.S. funds grew 9.5%, while Chinese equivalents skyrocketed 70%. This growth reflects smarter tools bridging gaps between traditional markets and physical assets.
| Region | ETF Growth | Daily Trading Volume |
|---|---|---|
| United States | +9.5% | $187B |
| China | +70% | $93B |
| Europe | +6.2% | $49B |
Real-time data dashboards now track metal prices alongside stock indices. Mobile apps let you trade fractions of ounces during market swings. One platform even uses blockchain to verify vault holdings instantly.
AI tools analyze mining reports and geopolitical events. They suggest portfolio adjustments before news hits mainstream media. Automated rebalancing maintains your target allocation as prices shift.
Looking for tailored solutions? The Gold IRA Match App connects you with vetted companies in minutes. Streamlined processes turn complex purchases into three-click transactions – no paperwork headaches.

Central Banks and Institutional Demand: A Data-Driven Insight
Major financial players are rewriting the rules of asset security. Institutions added over 1,100 tonnes to their gold holdings last year – the highest since records began. This strategic shift reveals how trusted stores of value anchor modern portfolios.
Trends in Central Bank Purchases
Recent data shows central banks buying bullion at triple 2020 rates. Emerging economies lead this charge, with India and Brazil doubling reserves since 2022. These moves stabilize national currencies while hedging against dollar volatility.
Your portfolio benefits from tracking these patterns. The Gold IRA Match App simplifies aligning your strategy with institutional trends. Real-time analytics help spot buying surges before they impact public markets.
Diversified holdings now serve dual purposes. They protect against inflation while offering growth potential during supply crunches. As industrial demand rises, these assets become indispensable for balanced wealth preservation.