Disclosure: This site is reader supported and purchases made through the links may generate a commision. Thanks for help supporting the site. Information only – not to be considered financial advice.
Battery electric vehicles often contain roughly 25–50 grams of silver each, a detail that changes how we think about resource demand at scale. This figure may seem small, but when millions of vehicles shift to electric power, the totals become significant for U.S. industry and markets.
This report examines a U.S.-focused trend analysis linking vehicle technologies to material needs. Modern vehicle architectures add many electronic modules and high-current contacts. Those connections favor silver for its conductivity and durability.
The central finding: modern electric designs require substantially more silver than internal combustion platforms. We preview measurable ranges—ICE, hybrid, and BEV silver loading—so the discussion stays grounded in numbers rather than hype.
Expect an explanation of what a claim like “2-3x higher” means in practice. Model differences, market mixes, and second-order drivers such as charging stations and grid hardware can raise total consumption beyond the vehicle itself. This is an industrial fundamentals analysis, not a short-term price forecast, though investors will find the indicators useful.
Key Takeaways
- BEVs often contain ~25–50 grams of silver per vehicle, raising aggregate demand as adoption scales.
- U.S.-centered analysis ties vehicle design changes to material consumption and market impacts.
- Electrification increases electronic modules and high-current contacts that favor silver.
- Ranges vary by model and market; per-vehicle grams matter when millions of units are produced.
- Charging infrastructure and power electronics add incremental material demand beyond cars.
What’s driving the new silver story in 2025
Industrial appetite has reshaped the market backdrop for 2025. After a modest gain of 0.66% in 2023, the metal is up over a whopping 130% YTD through 12/26/2025, a rally driven largely by manufacturing and power-system demand and shortages rather than pure investment flows.
Silver’s 2025 rally and why industrial demand matters now
Macro drivers—rate expectations and geopolitical risk—helped ignite the move, but structural change kept it alight. Western ETFs shed roughly 50 million ounces in 2024 even as industrial demand rose.
Industrial uses now dominate total demand
Industrial demand now represents about 55% of total demand, roughly 654 million ounces within a ~1.2 billion-ounce market in 2024, an 11% increase year-over-year. Forecasts point to an additional ~9% gain in 2025, signaling persistent pressure from manufacturing and electrification projects.
This is not only a precious metals narrative for investors; it is increasingly a manufacturing and electrification story. Later sections cover the main industrial engines: electric vehicles, charging networks, solar PV, and AI-linked electronics.
Why EVs use 2-3x more silver
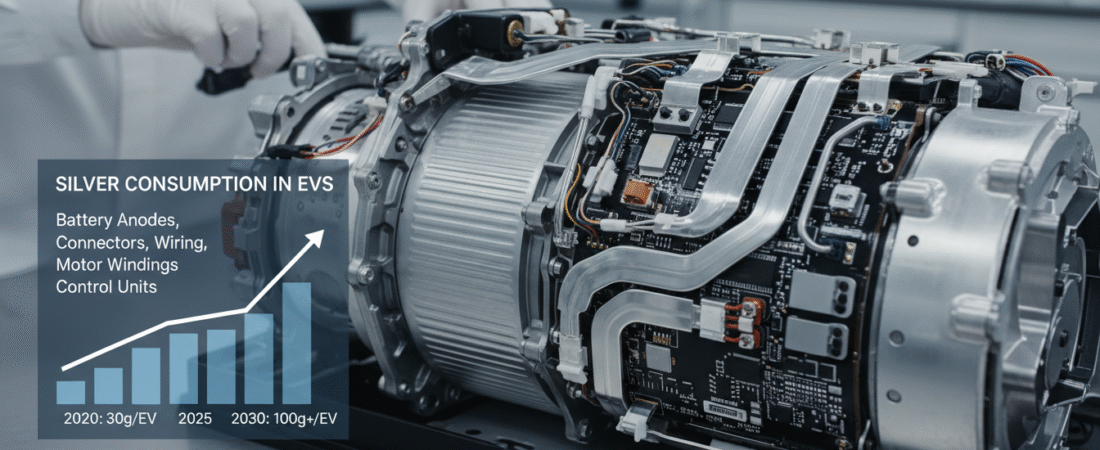
Moving from internal combustion platforms to battery drivetrains raises per-unit conductive metal needs. A compact comparison helps: light ICE vehicles typically contain ~15–28g, hybrids ~18–34g, and full battery models ~25–50g. That step-up reflects added power electronics and higher-voltage wiring.
Silver loading per vehicle: ICE vs hybrid vs BEV (grams per vehicle)
Internal combustion: ~15–28g. Hybrid: ~18–34g. Battery: ~25–50g. These ranges capture controller count, high-current contacts, and inverter complexity that increase with electrification.
Why silver is hard to replace in automotive electronics
Silver has the lowest electrical resistance among common metals at standard temperatures. That property matters for relays, switches, and contact surfaces where tiny losses mean heat and reliability risks.
Performance and longevity are established across suppliers, so alternatives often require trade-offs in life or conductivity. For safety-critical systems, designers prefer proven contact metallurgy.
Urgent Update for 2026! Our Top Recommended Company: Metals Edge
Metals Edge Only Deals in BULLION, is a MARKET MAKER, and is a LICENSED, BONDED, and INSURED Floriday Corporation!
Metals Edge will NEVER Sell you Premium or Collectible Metals at Crazy Markups!
They are the best in FAIR PRICES, HONESTY, and CUSTOMER SERVICE.
Get the Metals Edge Investor Guide Right Away
Discover how investors use gold and silver to diversify retirement savings, reduce exposure to paper assets, and pursue more value through low-premium precious metals strategies.

How safety and emissions tech increases silver use over time
Mandated safety and emissions controls add sensors, modules, and redundant circuits. Anti-lock braking, airbag firing networks, and driver monitoring systems expand connection counts even in non-battery models.
Combine that with controllers, inverters, battery management, and thermal systems in battery platforms, and small gram increases per vehicle scale into significant national demand as U.S. sales grow later this decade.
- Drivers of the step-up: higher-voltage architectures, extra power electronics, and larger sensor/compute stacks.
- Design reality: grams per vehicle vary by model, supplier choices, and regulation—so “1.5x to >2x” is a practical directional summary.
Where silver goes inside electric vehicles
Electronic contacts and joining materials are where a single vehicle concentrates much of its conductive metal load. That statement maps neatly to components that open, close, or carry high current under real-world stress.

Electrical contacts: switches, relays, protection devices
Switches for power and accessories, relays that route circuits, and protection devices such as fuses and circuit breakers rely on top-tier conductivity. These parts see repeated cycles and fault currents, so durability and low resistance matter.
Safety systems and driver-assist electronics
Advanced driver assistance modules increase sensors, control units, and redundant pathways tied to braking and airbag deployment. That expands the count of high-reliability contact points and raises component-level demand.
Alloys, joining materials, and automotive glass
Silver-containing alloys and brazes join steel and aluminum in lightweight designs. They solve dissimilar-metal challenges and maintain electrical continuity in power structures.
Automotive glass also contains conductive ceramic lines and pastes used for defrosting and antenna traces, linking comfort and safety to material consumption.
“Many of these applications are not optional; they meet regulation, warranty, and performance targets that make substitution difficult.”
- Key hardware: switches, relays, fuses, circuit breakers.
- Safety links: airbags, automatic braking, driver monitoring.
- Non-obvious uses: joining alloys and conductive pastes in glass.
| Component | Function | Why conductive metal matters |
|---|---|---|
| Switches & relays | Control power/accessories | Low resistance for durability under load |
| Fuses & breakers | Protect circuits | Reliable fault interruption at high current |
| ADAS control units | Safety & sensor fusion | High-reliability signal paths and redundant contacts |
| Joining alloys & brazes | Connect dissimilar metals | Maintain mechanical and electrical integrity |
| Conductive pastes in glass | Defrost and antenna traces | Thin-film conductivity with long-term adhesion |
Net effect: increased electronic content and higher-current architectures translate into a higher count of critical contact points. That drives material consumption at scale across U.S. vehicle fleets.
EV adoption trends that amplify silver demand in the United States
Rapid shifts in buyer preference are changing the mix of new cars sold, and that shift shapes industrial demand for conductive metals.
U.S. sales momentum has accelerated. In 1H 2023, electric vehicles reached about 9% of passenger vehicle sales, up from roughly 2% in 2020. That pace compresses fleet turnover and raises manufacturing demand ahead of large-scale fleet replacement.
U.S. momentum and the path to 2030
Analysts project at least 25% EV share by 2025 and over 50% by 2030. Each percentage point of penetration converts directly into additional per-vehicle conductive metal demand at the factory.
State tipping points and regional impact
Ten states now exceed a 10% EV sales share, and California sits near 25%. Those local tipping points show acceleration is spreading beyond coastal markets and altering regional vehicle mixes.
“New sales drive material demand first — manufacturing leads fleet transformation.”
| Metric | Recent value | Implication for demand |
|---|---|---|
| U.S. EV sales (1H 2023) | 9% of sales | Immediate rise in factory metal consumption |
| States ≥10% EV share | 10 states | Broader geographic growth in vehicle mix |
| California share | ~25% | Example of rapid local acceleration |
| Forecast | ≥25% by 2025; >50% by 2030 | Long-term growth in industrial demand and charging infrastructure needs |
Net effect: rising penetration amplifies national demand patterns. Each incremental vehicle adds material needs, and charging and grid buildout widen total demand beyond the car itself.
Charging infrastructure is a hidden silver demand driver
Each charging port adds factory hardware that scales with fleet growth. The National Renewable Energy Laboratory estimates roughly 28 million U.S. charging ports will be needed by 2030. That total covers public stalls, workplace banks, multifamily chargers, fleets, and millions of home installs.
Why buildout scale matters: projected need for 28 million ports
The sheer count implies extensive manufacturing of connectors, contact assemblies, and power cabinets. Even modest per-unit material content multiplies into large aggregate consumption when millions of devices are produced.
Grid, connectors, and power electronics: how infrastructure adds to consumption
High-current connectors, switching and protection gear, transformers, and inverters rely on high-reliability contact metals. Those parts face heat, arcing, and frequent cycling, so designers pick proven coatings and alloys.
Result: infrastructure components create incremental demand alongside vehicle demand. Grid upgrades—distribution switchgear, control systems, and protective relays—also contain contact materials that raise overall industrial demand.
“Charging networks convert fleet growth into a parallel manufacturing program for electrical gear.”
- Hidden driver: hardware scales with ports, not just vehicles.
- Key locations: connectors, contact points, switching/protection, and power electronics.
- Compound effect: grid-side upgrades add to national material consumption.
EVs aren’t the only force: solar panels and AI compound industrial silver demand
Beyond vehicle fleets, solar installations and AI data centers are stacking up to push industrial metal needs higher. These channels amplify the same trend: rising deployment of electronics and power hardware that require high-conductivity materials.

Solar PV: paste, thrifting, and structural demand
Silver paste captures electrons on cells and carries current to panel leads. Manufacturers have reduced per-cell loading from ~521 mg in 2009 to ~111 mg today through “thrifting.”
Thrifting lowers grams per cell, but does not eliminate overall demand when installations surge.
Photovoltaics in ounces and share
Photovoltaics consumed about 142 million ounces in 2023, roughly 13.8% of global usage. With BloombergNEF forecasting ~32% solar industry growth in 2024, panel rollouts can raise annual metal demand even as per-cell content falls.
AI and data centers: rising power, rising hardware needs
Data centers drew ~340 TWh in 2022 and may exceed 700 TWh by 2026 and 1,400 TWh by 2030. That scale requires more servers, power supplies, and switchgear — all of which increase demand for contact metals and protective components.
“Solar and data-center growth can compound industrial demand even if one sector slows.”
- Solar panels remain a large consumer of the metal despite thrifting gains.
- Photovoltaics already account for a material share measured in tens of millions of ounces.
- AI-driven electrification boosts manufacturing of silver-intensive electronics and grid hardware.
Supply constraints and market deficits: why silver demand can outpace production
The supply picture is tight: output is essentially flat while demand drivers are accelerating. Mine production has shown almost no growth over the last ten years and fell about 1% in 2023.
Mine trends and disruption risk
2024 production is expected to decline roughly 1% to ~823 million ounces. Recycling and scrap are set to remain flat, so total supply falls roughly 1% year-over-year.
Operational outages, permitting delays, and geopolitical issues can make those flat figures volatile in a single year.
By-product mining limits quick responses
Only 28.3% of producing operations are primary silver mines. Most output is tied to copper, lead, zinc, or gold projects.
That means higher prices do not always trigger rapid supply growth, since decisions follow the economics of the host metals.
Deficits and shrinking inventories
Market deficits are tightening; 2024’s shortfall is forecast to increase about 17%. Major exchange inventories have plunged by roughly 480 million ounces since Feb 2021.
“Persistent deficits and falling stocks signal a physical market that can tighten quickly when industrial demand rises.”
- Core risk: rising industrial demand against constrained supply.
- Elasticity problem: by-product and flat recycling limit fast responses.
- Implication: automotive, solar, and infrastructure buildouts can strain the system over years, not months.
Price and investor implications: what to watch next
A practical monitoring framework helps investors judge whether industrial demand will sustain higher prices.
Key indicators to track
- U.S. EV sales trajectory and monthly registration data.
- Charging-buildout pace and announced public port targets.
- Solar installation quarterly reports and panel shipment data.
- Industrial demand updates and ETF flows (physical holdings).
How fundamentals and flows interact
ETF flows still matter: the ~50 million ounce outflow in 2023 shows financial positioning can amplify volatility even when manufacturing drives demand.
| Indicator | Why it matters | Read frequency |
|---|---|---|
| EV sales | Directly converts to factory metal demand | Monthly |
| Solar installs | Large annual ounces despite thrifting | Quarterly |
| ETF holdings | Shows financial liquidity and potential price swings | Weekly |
Scenarios: faster electrification or robust solar growth supports higher silver prices given shrinking inventories (-~480M oz since Feb 2021). A supply shock would amplify that effect.
“Monitor data, not headlines; a monthly watch list beats reactive trading.”
Watch list (monthly/quarterly): EV registrations, port build announcements, solar shipment reports, ETF holdings, and industrial demand releases. These data points guide investment positioning between precious metals like gold and silver.
Conclusion
The analysis shows a clear industrial shift.
The report finds battery vehicles typically carry ~25–50g of silver per vehicle versus ~15–28g for internal combustion models. That step raises aggregate demand when national sales scale.
Charging networks, solar PV, and AI-linked hardware add layers of demand across manufacturing and grid projects. U.S. charging needs projected toward 28 million ports through 2030 make that effect measurable.
Supply remains challenged: 2024 mine output targets ~823 million ounces, inventories are down roughly 480 million ounces since Feb 2021, and deficits persist. That imbalance links adoption-driven growth to potential market pressure.
Read the indicators, update assumptions, and track monthly data to judge how industrial energy transitions will shape demand and investor decisions.